

Interactive Data Visualization with Processing

Interactive Data Visualization with Processing
MOV | AVC 531kbps | English | 960x540 | 15fps | 7h 43mins | AAC stereo 96kbps | 590 MB
Genre: Video Training
IStart communicating ideas and diagramming data in a more interactive way. In this course, author Barton Poulson shows how to read, map, and illustrate data with Processing, an open-source drawing and development environment. On top of a solid introduction to Processing itself, this course investigates methods for obtaining and preparing data, designing for data visualization, and building an interactive experience out of a design. When your visualization is complete, explore the options for sharing your work, whether uploading it to specialized websites, embedding the visualizations in your own web pages, or even creating a desktop or Android app for your work.
Topics include:
Exploring the need for creative data visualization
Drawing basic lines and shapes
Introducing variables, strings, and arrays
Modifying drawing attributes such as color
Making drawings more dynamic with animation loops and spirals
Creating keyboard- and mouse-based interactions
Adding images, video, and sound
Reading in text or XML data
Creating plots and charts
Publishing and sharing your work
Introduction 3m 16s
Welcome 58s
What you should know 1m 22s
Using the exercise files 56s
1. Basics of Visualization 11m 51s
Overview of data visualization 11m 51s
2. Basics of Processing 11m 53s
Installing Processing 3m 38s
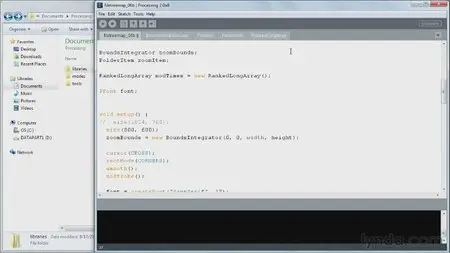
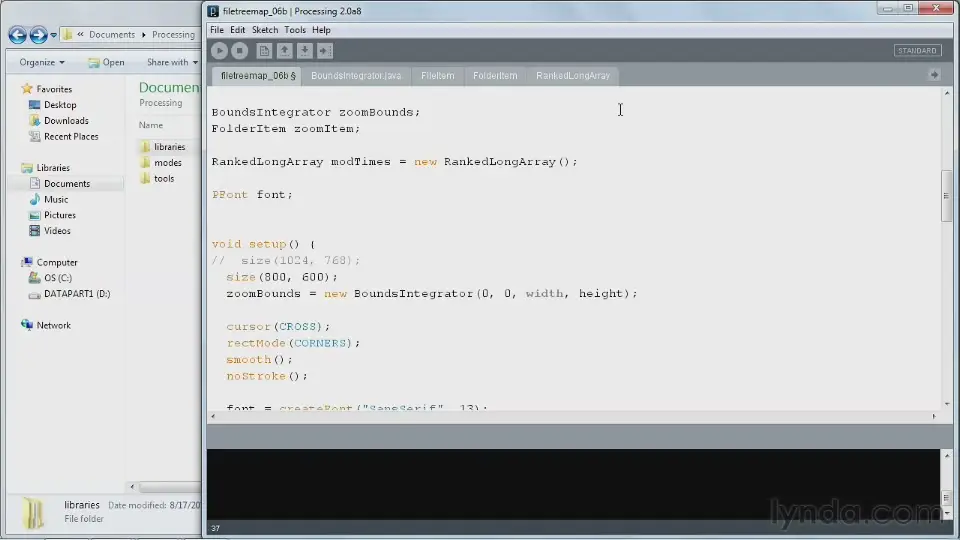
Overview of Processing 4m 5s
Exploring libraries 4m 10s
3. Basics of Drawing 1h 1m
Basic setup 7m 31s
Drawing points 4m 37s
Drawing lines 5m 6s
Drawing ellipses and circles 5m 24s
Drawing arcs 6m 54s
Drawing rectangles and squares 4m 58s
Drawing quadrangles 3m 25s
Drawing triangles 2m 55s
Drawing polygons 3m 37s
Drawing simple curves 4m 54s
Drawing complex curves 6m 46s
Drawing Bézier curves 5m 38s
4. Variables 54m 3s
Introduction to variables 10m 44s
Understanding variable scope 6m 53s
Modifying variables 9m 8s
Creating arrays 9m 53s
Modifying arrays 6m 37s
Creating strings 7m 3s
Modifying strings 3m 45s
5. Drawing Attributes 1h 2m
Incorporating randomness 7m 59s
Using Perlin noise 4m 24s
Shuffling with Java 3m 30s
Specifying line attributes 8m 2s
Changing placement modes 5m 45s
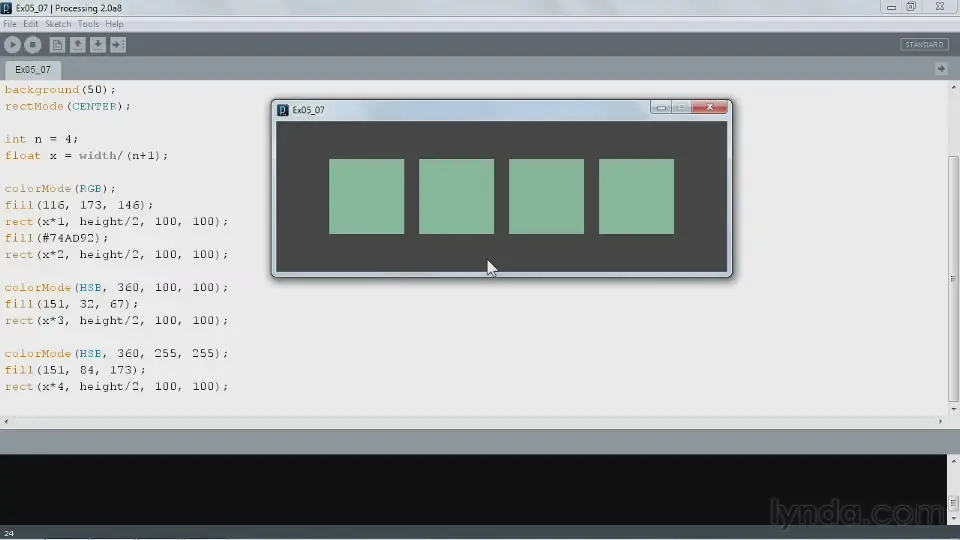
Understanding color attributes and functions 4m 16s
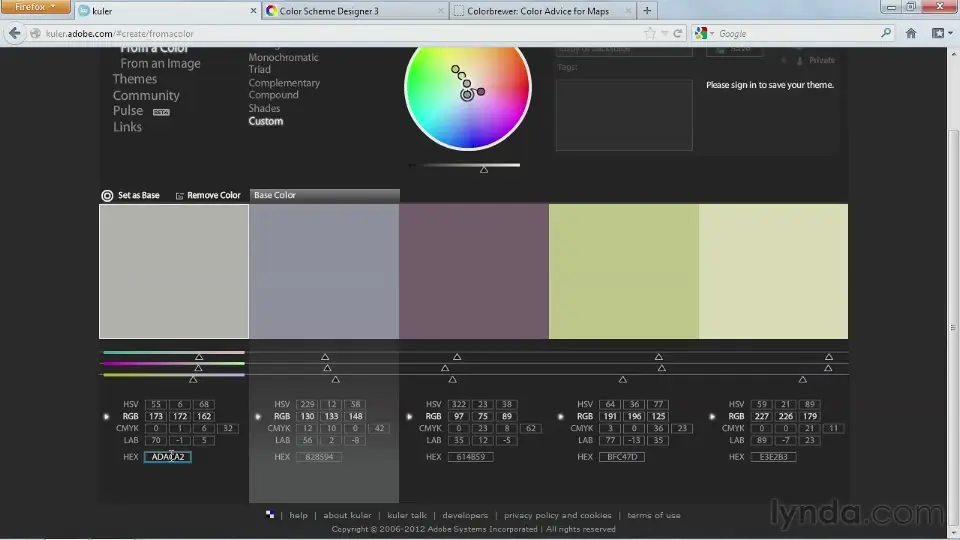
Exploring color spaces 7m 44s
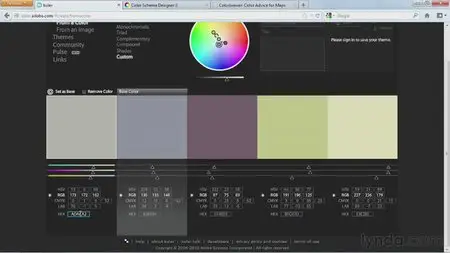
Using color palettes 7m 5s
Transforming the grid 8m 38s
Exploring the attribute matrix 5m 33s
6. Dynamic Drawings 52m 7s
Building code blocks 5m 57s
Writing a while loop 3m 52s
Using for loops 5m 35s
Creating conditionals 14m 50s
Working with easing 10m 51s
Creating spirals 11m 2s
7. Interaction 18m 55s
Mouse tracking 3m 54s
Hovering and clicking 11m 16s
Understanding keyboard interaction 3m 45s
8. Media 27m 32s
Specifying fonts 6m 43s
Using images 5m 51s
Playing a video loop 6m 20s
Exporting video 3m 47s
Adding sound 4m 51s
9. Grouping Code 20m 49s
Creating functions 11m 48s
Creating classes and objects 9m 1s
10. Reading Data 31m 10s
Using embedded data 5m 26s
Working with appended text data 6m 4s
Working with appended tabular data 10m 26s
Reading XML data 9m 14s
11. Varieties of Data Visualizations 48m 17s
Generating dot plots 11m 11s
Building scatter plots 10m 0s
Making line plots 9m 55s
Creating bar charts 9m 12s
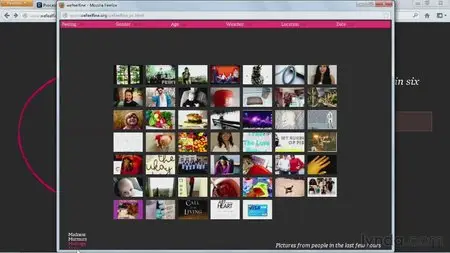
Checking out examples of maps, hierarchies, and networks 7m 59s
12. Elements of Design for Visualization 20m 57s
Introducing some principles of 2D design 13m 44s
Understanding color theory 7m 13s
13. Elements of Interaction 24m 46s
Interacting with zooming, rotating, and sliding 6m 26s
Implementing slicing 6m 47s
Using rollovers 5m 58s
Introducing the GUI libraries 5m 35s
14. Publishing and Sharing 10m 35s
Sharing via OpenProcessing and other sites 3m 19s
Saving as a desktop application 2m 42s
Saving as JavaScript 1m 47s
Saving as an Android application 2m 47s
Conclusion 2m 38s
Where to go from here 2m 38s
Format : QuickTime
Format/Info : Original Apple specifications
File size : 41.6 MiB
Duration : 9mn 14s
Overall bit rate : 629 Kbps
Encoded date : UTC 2012-09-22 04:49:12
Tagged date : UTC 2012-09-22 04:49:12
Writing library : Apple QuickTime
Copyright : lynda.com
Video #2
ID : 2
Format : AVC
Format/Info : Advanced Video Codec
Format profile : Main@L3.1
Format settings, CABAC : Yes
Format settings, ReFrames : 3 frames
Codec ID : avc1
Codec ID/Info : Advanced Video Coding
Duration : 9mn 14s
Bit rate mode : Variable
Bit rate : 531 Kbps
Width : 960 pixels
Height : 540 pixels
Display aspect ratio : 16:9
Frame rate mode : Constant
Frame rate : 15.000 fps
Resolution : 24 bits
Colorimetry : 4:2:0
Scan type : Progressive
Bits/(Pixel*Frame) : 0.068
Stream size : 35.1 MiB (84%)
Encoded date : UTC 2012-09-22 04:49:12
Tagged date : UTC 2012-09-22 04:49:12
Audio #1
ID : 1
Format : AAC
Format/Info : Advanced Audio Codec
Format version : Version 4
Format profile : LC
Format settings, SBR : No
Format settings, PS : Yes
Codec ID : 40
Duration : 9mn 14s
Bit rate mode : Variable
Bit rate : 96.0 Kbps
Maximum bit rate : 99.8 Kbps
Channel(s) : 2 channels
Channel positions : Front: L R
Sampling rate : 48.0 KHz
Resolution : 16 bits
Stream size : 6.34 MiB (15%)
Encoded date : UTC 2012-09-22 04:49:12
Tagged date : UTC 2012-09-22 04:49:12
Interactive Data Visualization with Processing
Interactive Data Visualization with Processing
Interactive Data Visualization with Processing
Interactive Data Visualization with Processing
No mirrors please