How to easily use ANN for prediction mapping using GIS data?

How to easily use ANN for prediction mapping using GIS data?
MP4 | Video: h264, 1920x1080 | Audio: AAC, 44.1 KHz
Language: English (US) | Size: 7.19 GB | Duration: 7h 16m
MP4 | Video: h264, 1920x1080 | Audio: AAC, 44.1 KHz
Language: English (US) | Size: 7.19 GB | Duration: 7h 16m
First Simplified Step-by-Step Artificial Neural Network Methodology in R for Prediction Mapping using GIS Data
What you'll learn
With Step by step description we will be together facing the common software and code misleadings.
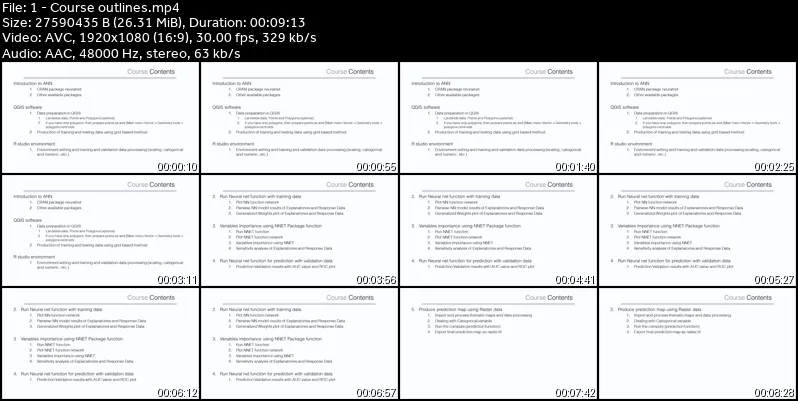
1. Produce training and testing data using automated tools in QGIS (Optional). Or jump this and using your own training/testing data directly.
2. Run NeuralNet function with training data and testing data. (use my QGIS tools as an option OR use your preferable data production technique directly)
3. Plot NN function network and get all the outputs like; Error rate, statistics, Pairwise and Generalized weight plot
4- Prediction and Validation Mapping Accuracy using AUC value of ROC plot
4. Produce and export prediction map using Raster data
Requirements
No prior knowledge in programming needed
Basic knowledge in R studio environment
Basic knowledge in GIS and QGIS is optional
Description
Artificial Neural Network (ANN) is one of the advanced Artificial Intelligence (AI) component, through many applications, vary from social, medical and applied engineering, ANN proves high reliability and validity enhanced by multiple setting options. Using ANN with Spatial data, increases the confidence in the obtained results, especially when it compare to regression or classification based techniques. as called by many researchers and academician especially in prediction mapping applications. Together, step by step with "school-bus" speed, will cover the following points comprehensively (data, code and other materials are provided) using NeuralNet Package in R and Landslides data and thematics maps.Produce training and testing data using automated tools in QGIS OR SKIP THIS STEP AND USE YOUR OWN TRAINING AND TESTING DATA Run Neural net function with training data and testing dataPlot NN function networkPairwise NN model results of Explanatories and Response DataGeneralized Weights plot of Explanatories and Response DataVariables importance using NNET Package functionRun NNET functionPlot NNET function networkVariables importance using NNETSensitivity analysis of Explanatories and Response DataRun Neural net function for prediction with validation dataPrediction Validation results with AUC value and ROC plotProduce prediction map using Raster dataImport and process thematic maps like, resampling, stacking, categorical to numeric conversion.Run the compute (prediction function)Export final prediction map as raster.tifIMPORTANT: LaGriSU Version 2023_03_09 is available (Free) to download using Github link (please search for /Althuwaynee/LaGriSU_Landslide-Grid-and-Slope-Units-QGIS_ToolPack)*LaGriSU (automatic extraction of training / testing thematic data using Grid and Slope units)
Who this course is for:
All students, researchers and professionals that interested in using data mining with GIS Data, All students, researchers and professionals that work on: Health [viruses susceptibility, noise maps, Epidemic expansions, Infectious Disease, Famine ], All students, researchers and professionals that work on: Hazards [ flooding, landslides, geological based, drought, air pollution..]
How to easily use ANN for prediction mapping using GIS data?