

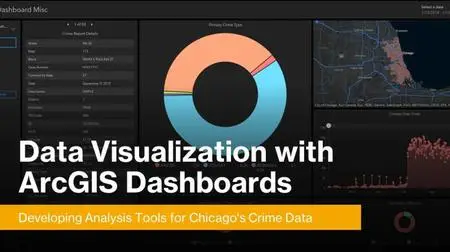
Data Visualization with ArcGIS Dashboards: Developing Analysis Tools for Chicago's Crime Data
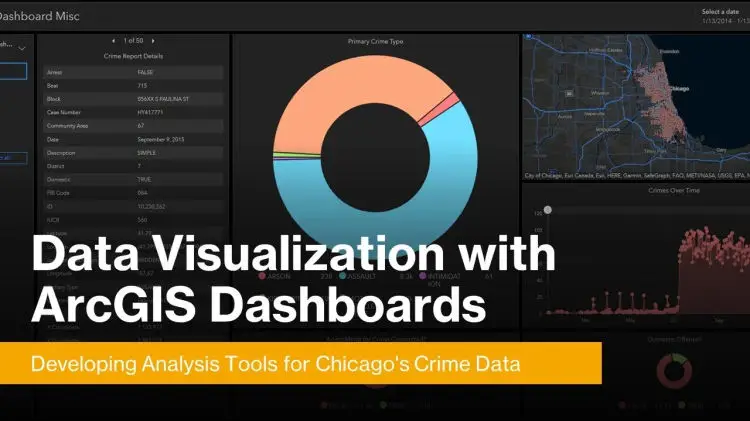
Data Visualization with ArcGIS Dashboards: Developing Analysis Tools for Chicago's Crime Data
Duration: 55m | .MP4 1280x720, 30 fps(r) | AAC, 48000 Hz, 2ch | 375 MB
Genre: eLearning | Language: English
Duration: 55m | .MP4 1280x720, 30 fps(r) | AAC, 48000 Hz, 2ch | 375 MB
Genre: eLearning | Language: English
In this course you will learn…
- How to build a data visualization using Chicago crime data
- How to configure dashboard widgets from scratch
- How to style your dashboard widgets to provide the best analytic value
This course will teach you the basic fundamentals of data visualization through ArcGIS Dashboards.
This skill is highly useful and applicable in the fields of Data Science, Data Visualization, Data Analysis and GIS (Geographic Information Systems).
You will need an ArcGIS online or ArcGIS enterprise portal account access.
You will need to know how to create a feature layer from a CSV and how to add that layer to a map before starting this course.