Python Data Visualization: Create impactful visuals, animations and dashboards
Python Data Visualization: Create impactful visuals, animations and dashboards
ISBN: 9780135426531 | .MP4, AVC, 1280x720, 30 fps | English, AAC, 2 Ch | 6h 36m | 1.5 GB
Instructor: Bruno Goncalves
ISBN: 9780135426531 | .MP4, AVC, 1280x720, 30 fps | English, AAC, 2 Ch | 6h 36m | 1.5 GB
Instructor: Bruno Goncalves
The Sneak Peek program provides early access to Pearson video products and is exclusively available to subscribers. Content for titles in this program is made available throughout the development cycle, so products may not be complete, edited, or finalized, including video post-production editing.
Python Data Visualization: Introduction
Lesson 1: Human Perception
Topics
1.1 Understanding Color Theory
1.2 Overview of Human Vision
1.3 Color Schemes
Lesson 2: Analytical Design
Topics
2.1 Understand the Fundamental Principles of Analytical Design
2.2 Describe the Fundamental Tools of Visualization
2.3 Advantages and Disadvantages of Different Chart Types
Lesson 3: Data Cleaning and Visualizion with Pandas
Topics
3.1 DataFrames and Series
3.2 GroupBy and Pivot Tables
3.3 Merge and Join
3.4 The Plot Function
3.5 Demo
3.6 Time Series
3.7 Bar Plot Demo
Lesson 4: Matplotlib
Topics
4.1 Fundamental Components of a matplotlib plot
4.2 Explore the matplotlib API
4.3 Demo
4.4 Stylesheets
4.5 Demo
4.6 Mapping
4.7 Demo
Lesson 5: Matploltib Animations
Topics
5.1 Matploltib Animation API
5.2 Func Animation
5.3 Animation Writers
5.4 Demo
Lesson 6: Jupyter Widgets
Topics
6.1 ipywidgets as Interactive Browser Controls
6.2 Simple Wdget Use
6.3 Widget Customization
6.4 Demo
Lesson 7: Seaborn
Topics
7.1 Understand the Structure of seaborn
7.2 Understand the Differences with matplotlib
7.3 Explore the Seaborn API
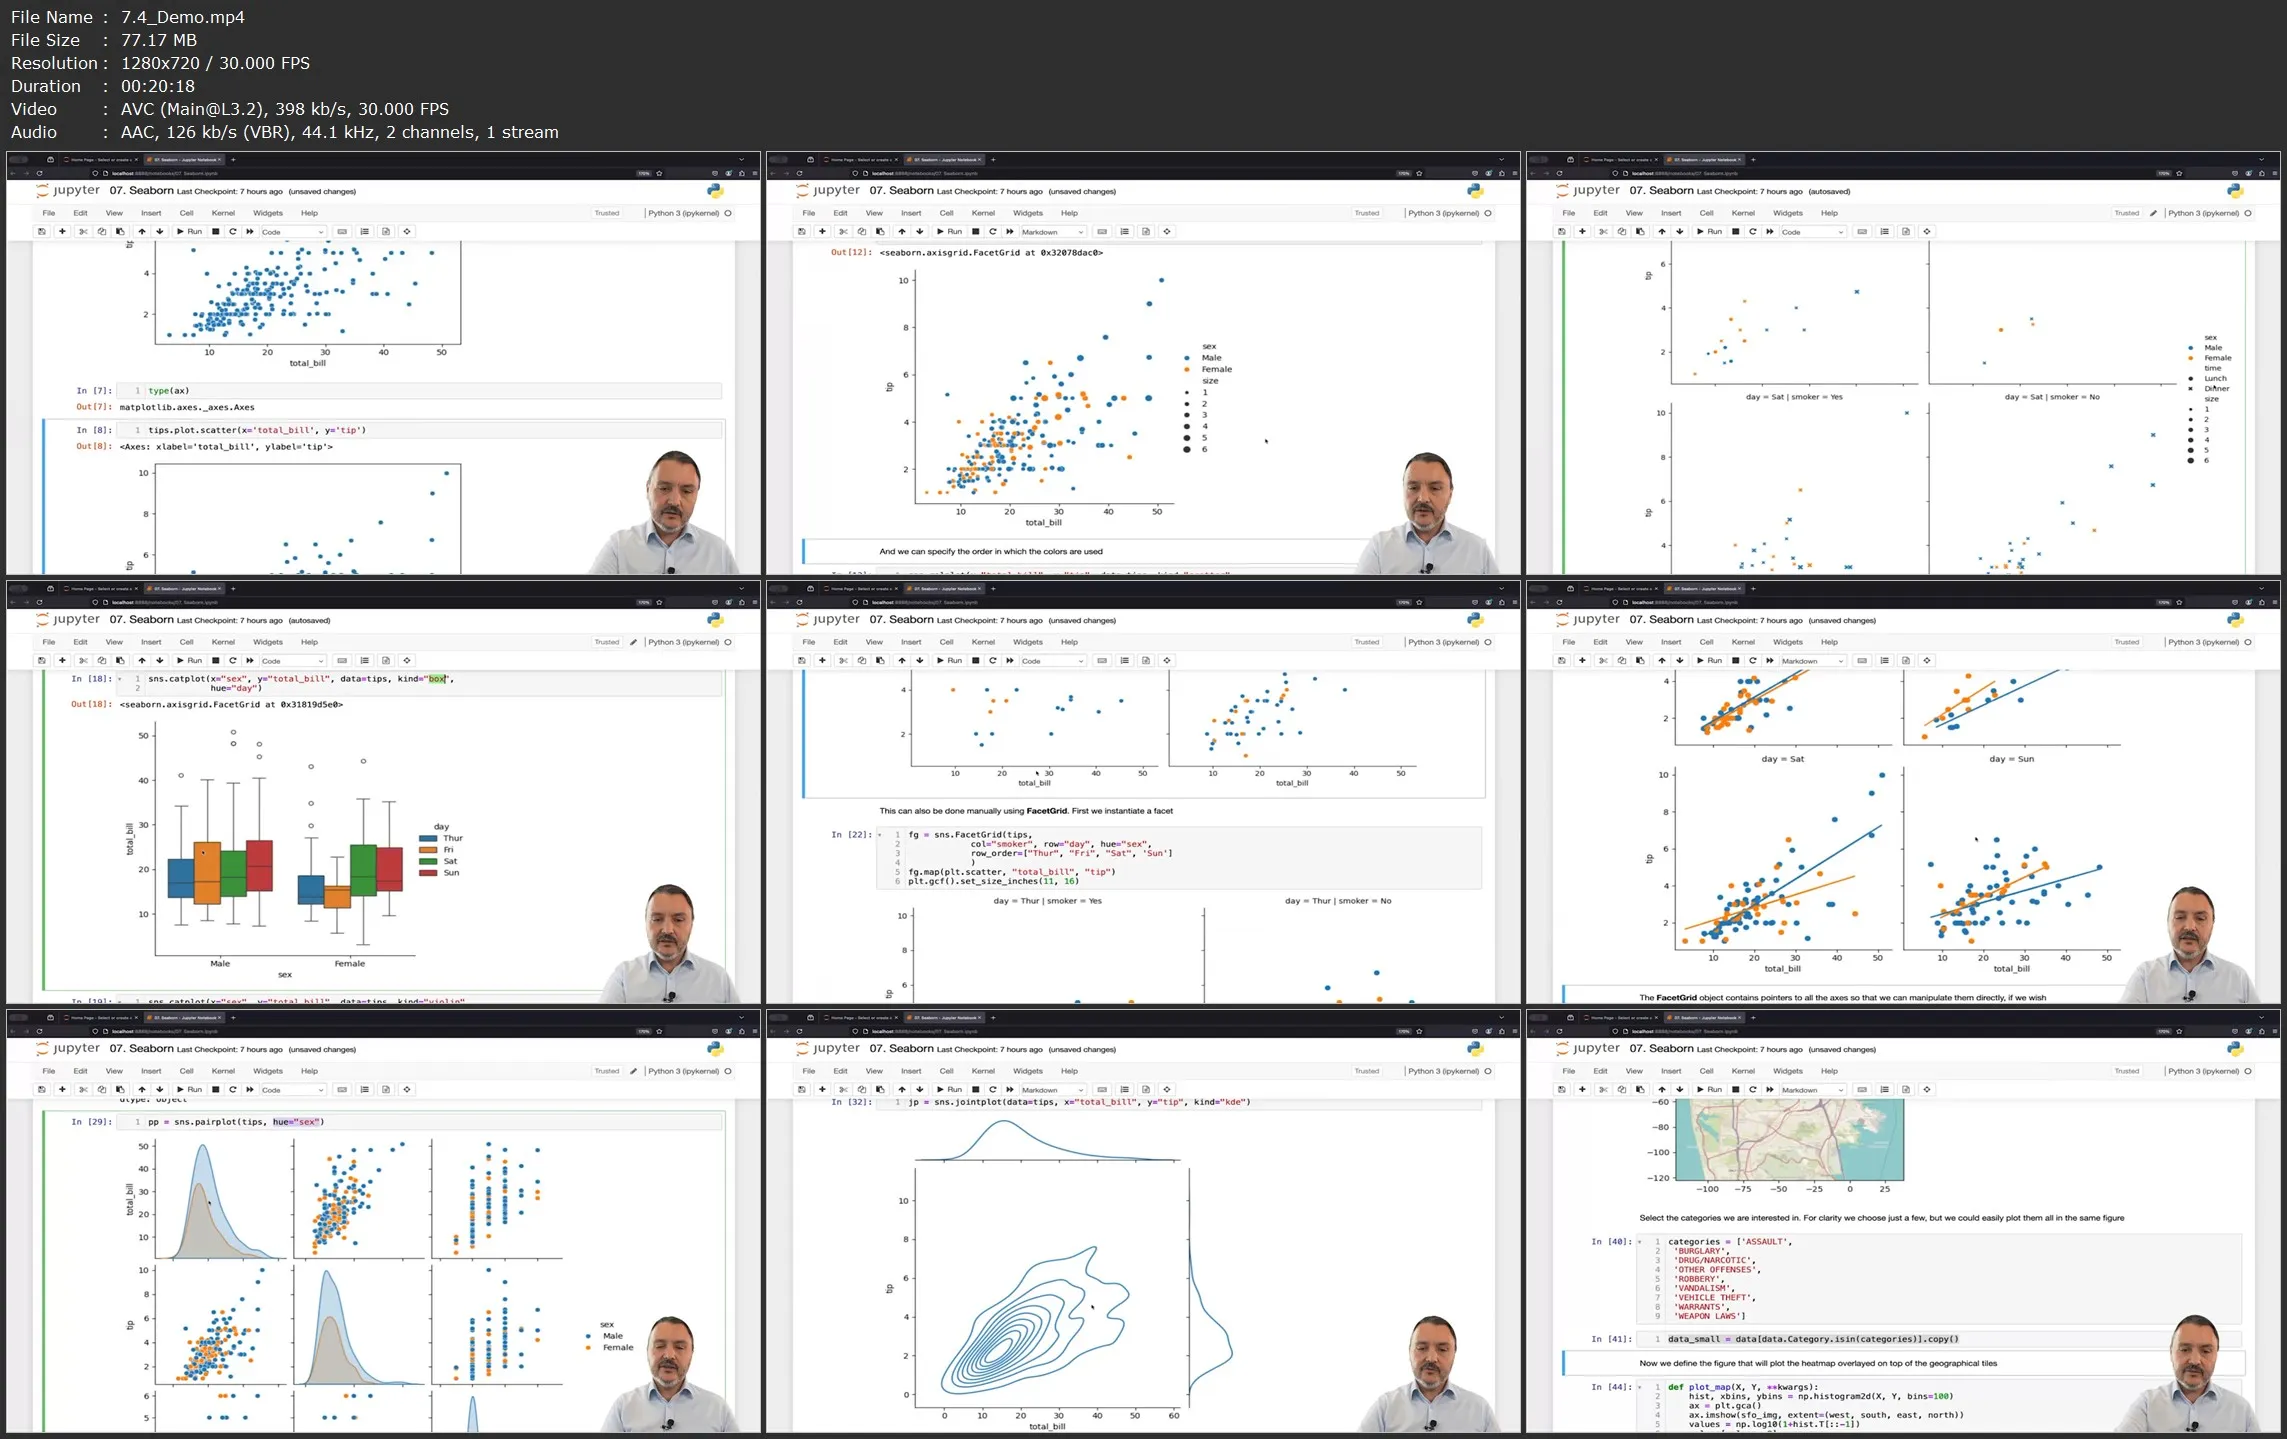
7.4 Demo
Lesson 8: Bokeh
Topics
8.1 Basic Plotting with Bokeh
8.2 Advanced Plotting
8.3 Networks
8.4 Demo
Lesson 9: Plotly
Topics
9.1 Basic Plotly
9.2 3D and Animated Plots
9.3 Demo
Summary
Python Data Visualization: Summary
Lesson 1: Human Perception
Topics
1.1 Understanding Color Theory
1.2 Overview of Human Vision
1.3 Color Schemes
Lesson 2: Analytical Design
Topics
2.1 Understand the Fundamental Principles of Analytical Design
2.2 Describe the Fundamental Tools of Visualization
2.3 Advantages and Disadvantages of Different Chart Types
Lesson 3: Data Cleaning and Visualizion with Pandas
Topics
3.1 DataFrames and Series
3.2 GroupBy and Pivot Tables
3.3 Merge and Join
3.4 The Plot Function
3.5 Demo
3.6 Time Series
3.7 Bar Plot Demo
Lesson 4: Matplotlib
Topics
4.1 Fundamental Components of a matplotlib plot
4.2 Explore the matplotlib API
4.3 Demo
4.4 Stylesheets
4.5 Demo
4.6 Mapping
4.7 Demo
Lesson 5: Matploltib Animations
Topics
5.1 Matploltib Animation API
5.2 Func Animation
5.3 Animation Writers
5.4 Demo
Lesson 6: Jupyter Widgets
Topics
6.1 ipywidgets as Interactive Browser Controls
6.2 Simple Wdget Use
6.3 Widget Customization
6.4 Demo
Lesson 7: Seaborn
Topics
7.1 Understand the Structure of seaborn
7.2 Understand the Differences with matplotlib
7.3 Explore the Seaborn API
7.4 Demo
Lesson 8: Bokeh
Topics
8.1 Basic Plotting with Bokeh
8.2 Advanced Plotting
8.3 Networks
8.4 Demo
Lesson 9: Plotly
Topics
9.1 Basic Plotly
9.2 3D and Animated Plots
9.3 Demo
Summary
Python Data Visualization: Summary
Python Data Visualization: Create impactful visuals, animations and dashboards