

Mastering Data Visualization: Matplotlib, Seaborn, Plotly, and Bokeh
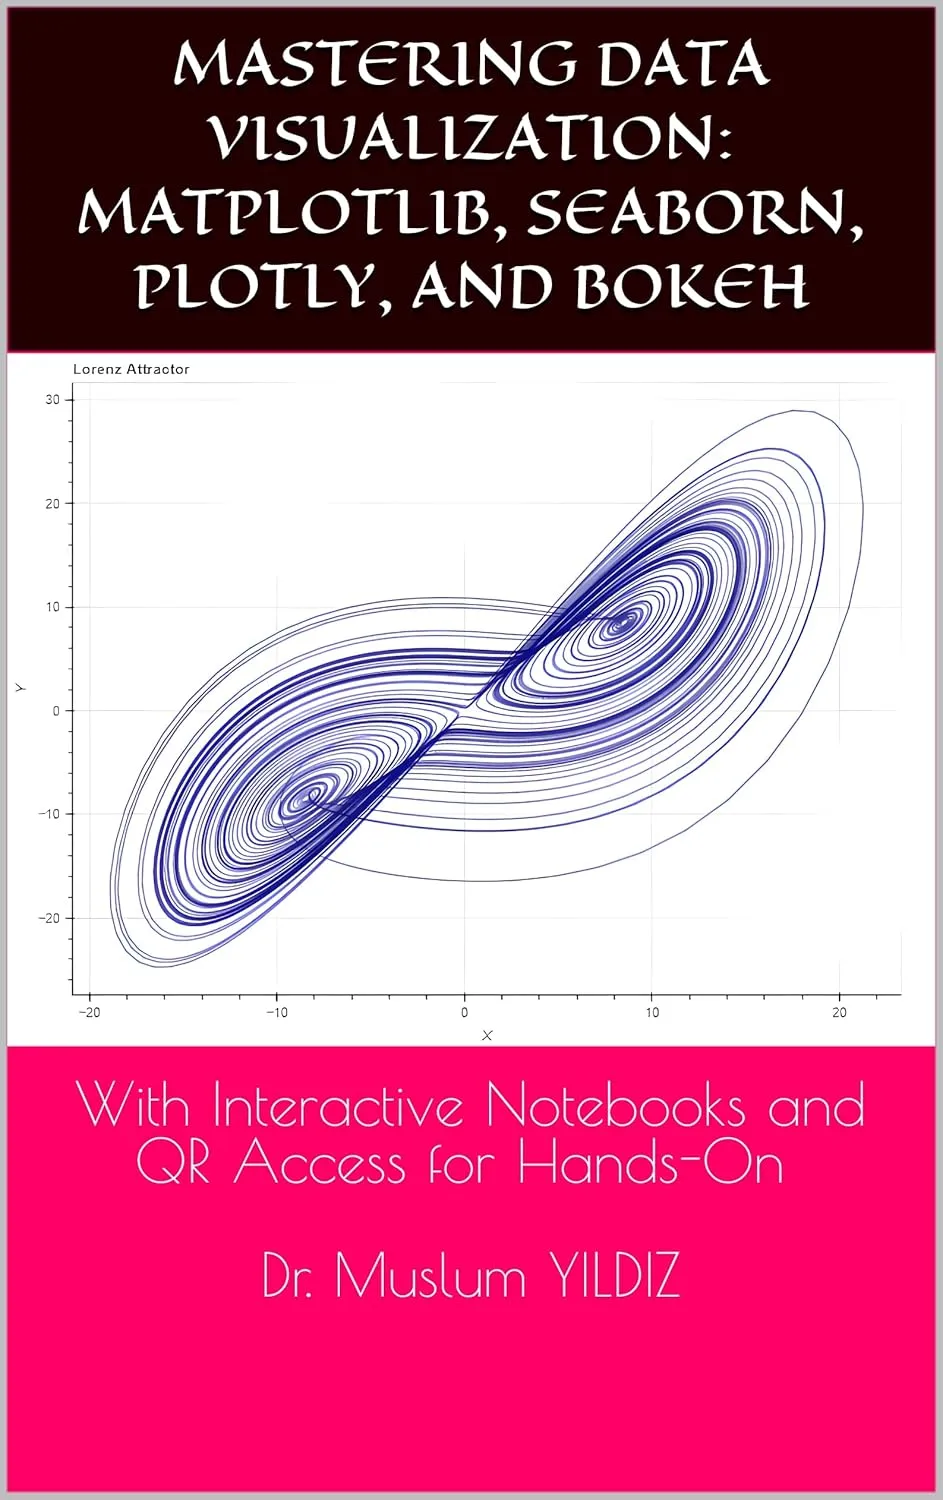
Mastering Data Visualization: Matplotlib, Seaborn, Plotly, and Bokeh by Muslum Yildiz
English | December 25, 2024 | ISBN: N/A | ASIN: B0DRKS6DJS | 330 pages | EPUB | 52 Mb
English | December 25, 2024 | ISBN: N/A | ASIN: B0DRKS6DJS | 330 pages | EPUB | 52 Mb
In a world overflowing with data, the challenge isn't just collecting or analyzing information—it’s making sense of it. Imagine this: a snowflake, as delicate as it is intricate, forms under unique atmospheric conditions—temperature, humidity, wind speed—all converging to create a one-of-a-kind structure. Each snowflake is different, even though they share the same general structure. In the same way, data comes in countless forms, each with its own nuances and characteristics, and just as no two snowflakes are the same, no two data points should be treated as identical.
The snowflake metaphor speaks to the heart of data visualization. Just as a snowflake's formation depends on countless variables, every dataset is shaped by unique circumstances. Visualizing this data requires not only understanding the numbers but also recognizing the patterns, anomalies, and stories embedded within. The magic of data visualization lies in transforming raw data into something meaningful, allowing us to spot the trends and make decisions faster than ever before.
This book, Mastering Data Visualization: Matplotlib, Seaborn, Plotly, and Bokeh, takes you on a journey through the world of data visualization tools and techniques. From the basics of data types to the powerful capabilities of libraries like Matplotlib, Seaborn, Plotly, and Bokeh, we'll explore how to create visualizations that speak to both the heart and the mind. But, much like a snowflake, the process of learning data visualization is anything but linear. It requires a mix of creativity, technical know-how, and the patience to see the beauty in the data’s subtle patterns.
As we dive into this book, remember that visualization is not just about making numbers look nice—it’s about telling a compelling story. By the end, you’ll not only know how to use these tools but also understand how to shape your data into stories that engage and inform. Whether you are a data scientist, a business analyst, or someone who just loves uncovering the secrets hidden in data, this book is for you.