

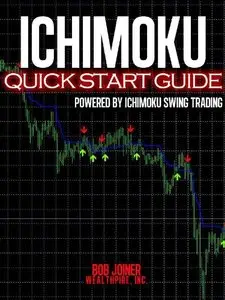
The Beginner's Guide To The Ichimoku Stock Trading System
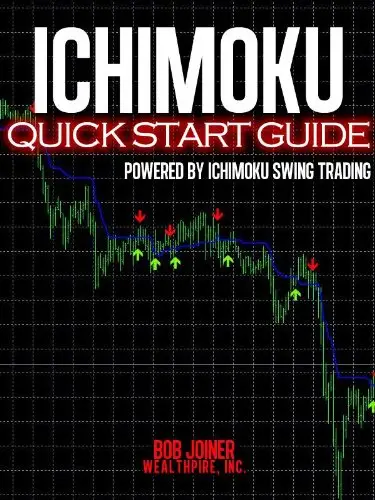
The Beginner's Guide To The Ichimoku Stock Trading System by Bob Joiner
English | 29 Aug. 2013 | ASIN: B007ZET98I | 15 Pages | EPUB/MOBI/PDF (conv) | 3.69 MB
English | 29 Aug. 2013 | ASIN: B007ZET98I | 15 Pages | EPUB/MOBI/PDF (conv) | 3.69 MB
For most of you, the term Ichimoku is a brand new term for you. You may have never heard the word, much less seen a chart example. And I’ll be honest with you. When I first looked at an Ichimoku chart, I thought “No way. This is far too confusing to be of any use to me.” But then I did a little study, finding bits and pieces of information, scattered here and there among various web sites. And the subject began to intrigue me. As I understood more and more about what the charts were telling me, I became hooked…because the charts reveal so much and (once understood) can improve your trading substantially.
One of our greatest imports was candlestick charting. Created for trading the rice market about 150 years ago, candlestick charts are widely used by traders today. Why? Because they give a better visual representation of price movement and investor sentiment than the old bar charts.
Well, in the 1940’s a Japanese journalist by the name of Goichi Hosoda began creating moving averages for these candlesticks. Prior to the advent of computer programming, his elaborate system utilized dozens of workers who plotted his moving averages each day.
And it wasn’t an ordinary system of moving averages. Goichi used a variety of moving averages, plotting them both in their current time frame and also plotting them into the future. These moving averages give support and resistance lines, much like traditional western moving averages. But Goichi also pointed these numbers into the future, giving the charts an almost predictive nature.
So let me ask you a question. If you could look into the future of a chart, looking at possible areas of support and resistance in future time (not just current time), do you think it could help your trading? Of course it could help you. Welcome to the world of Ichimoku Swing Trading!