

RS Zip file 0,65Mb
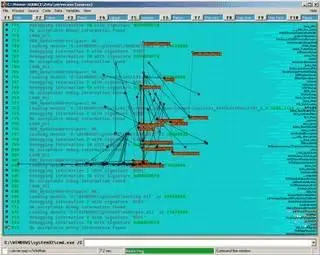
Zeta Debugger v1.3
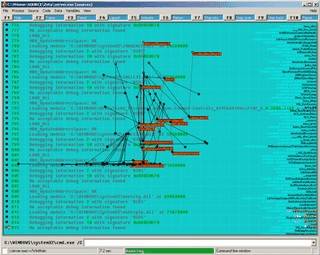
Zeta Debugger is a stand-alone source level debugger and code profiler for Windows 98/2000/XP applications written in C/C++ or assembly languages. Source level debugging is allowed when symbolic debug information emited by your compiler is one of those supported by our debugger or external plug-in modules. Otherwise, when this information is absent or not recognized, you can only debug at machine level.
At this moment the debugger supports a several number of debugging formats used by compilers of two most known companies - Borland and Microsoft. In the future we plan to add more formats to support.
Partially or fully supported formats:
Compiler ??? Format Marker ??? Compiler Version
Borland C++ ??? FB07, FB08, FB09, FB0A ??? BCC4, BCC5, BCC5.5
Visual C++ ??? NB09, NB11, NB10
Key features
- Built-in support of Borland C++ and Visual C++ compilers
Plug-in API, from which you can load any other debugging formats
Plug-in API to execute user written commands
The single navigator window with multiple functions
Graphical representation of jumps between instructions
Animation of process execution
Syntax hiliting for C/Asm panels
Back Step command, undoing changes made by last instruction
Full and convenient keyboard control
Popup help window for keyboard commands
Inspector of program's structure
Data guards on memory read/write operations
Cover panel with the list of recent files
Graphical representation of current module's sections
Automatic symbol hyperlinks in C/Asm panels
Automatic / manual insertion of comments
Automatic address correction after program recompilation
List view of call frames
Log file navigator
MMX registers
Support for 64 integer expressions
JIT (Just In Time) debugging support
Added in release 14.06.07:
- JIT debugging support.
Command line instructions: PID:n, FILE:filename, RUN[:address], MAXIMIZE.
Comment alignment in the data panel.
Extensible context help for each command.
MMX registers.
64 integers.
Now all filtered strings are hilited in the log panel.
Last error code in CPU panel and its description text in the status bar.
CPU panel: TIB (thread information block) pseudo register.
Now you can write READ-ONLY sections.
In the code panel now you can search for any part of instruction.
Copying of data is now compatible with the insert operation.
Now you can copy the data selection as bytes or as preslashed characters.
Make a double click in the data panel to jump to the address referenced by the dword.
More Information :
http://fyzor.com/debugger/
Zipfile 0,65Mb No pass
http://rapidshare.de/files/28568835/Zeta_Debugger_v1.3.zip