


SAS JMP Statistical Discovery v9.0.2
SAS JMP Statistical Discovery v9.0.2 | 434 MB
What if you could explore your data to see the story behind the numbers? You can. Created by SAS for statistical discovery, every product in the JMP software suite is visual and interactive, comprehensive and extendible. No matter what your field, we have a product that will help you connect with your data - whether you are new to statistical analysis or are a seasoned statistician.
Your analytic options continue to expand with JMP 9. You get powerful new ways of understanding, visualizing and communicating what your data is telling you. And when you make JMP your analytic hub, you can leverage your other favorite tools: SAS, Excel and R. You can also incorporate geographic maps into your JMP visualizations. Plus, an updated interface on Microsoft Windows makes for a fresh user experience.
SAS JMP Statistical Discovery v9.0.2
Now you also choose the JMP version that suits your needs best. JMP 9 is the latest version of the interactive, dynamic software for statistical discovery that users worldwide know and love – with lots of major enhancements. And JMP Pro contains everything in JMP plus advanced analytic techniques for data mining and predictive modeling.

SAS JMP Statistical Discovery v9.0.2
Bring JMP and Excel together
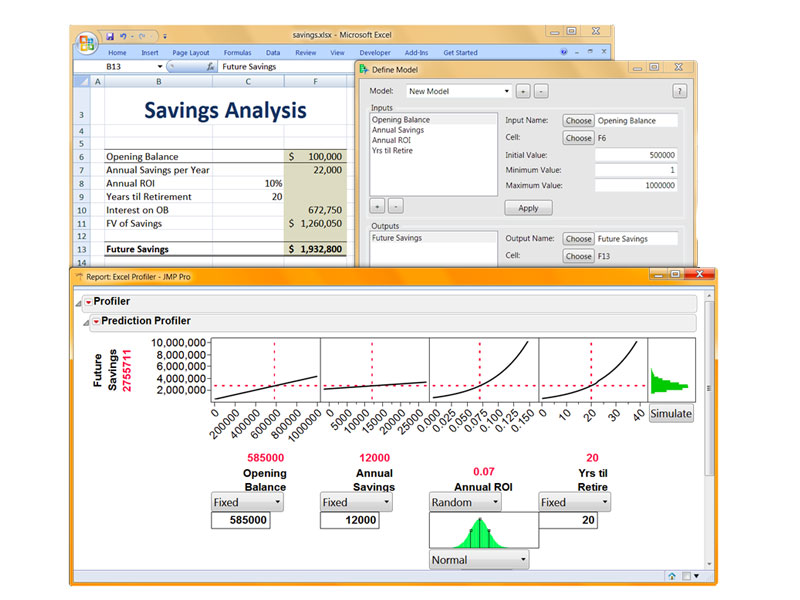
With the JMP Add-In for Microsoft Excel, you can easily take your data from Excel into JMP. You can also bring the power of the JMP Profiler visualization to your Excel spreadsheets. Interactively explore what-if scenarios using the Profiler as Excel calculates the model in the background, receiving inputs from JMP and sending back outputs. Use JMP’s optimizer to find the best solutions to your stickiest problems and get instant insight into the key factors influencing risk with the simulator built into the Profiler.
Map out your data
If you’ve got geographic data, JMP 9 makes it easy to visualize it on a map. Choose from built-in high-quality images, or use your favorite Web Map Service (WMS) to get custom map images from the Internet on the fly. For even more options, JMP 9 includes shape files for borders of many geographic regions and lets you add your own custom shapes, such as for a manufacturing plant or campus.
Make and share custom add-ins
With JMP 9, it’s easier than ever to extend the use of powerful analytics throughout your organization. You can create JMP add-ins – custom analytic applications to share with other JMP users. You can even customize menus and toolbars for your JMP add-in. Look for add-ins that enhance JMP's capabilities at www.jmp.com/addins.
Flexibly arrange JMP® windows
Enjoy the updated look and flexibility of JMP 9 on Microsoft Windows. JMP windows now float freely instead of residing within a single parent window. Each window is independent of others, so you can arrange and manipulate JMP windows across multiple monitors or side by side on the same monitor. A number of new auto-arrangement features also ease the process of discovery when using multiple views of your data. And JMP’s new Home window gets you into your work efficiently by helping you navigate all open JMP windows and listing files you opened recently.
Predict product quality
The new Degradation platform in JMP 9 lets you analyze product deterioration data over time to help predict product quality and warranty risk. JMP 9 can analyze data resulting from both nondestructive – repeated measures or stability analysis – and destructive testing.
Using these techniques, you can make performance predictions before products and components become ineffective or fail altogether. Define the best model (linear or nonlinear), create pseudo-failure times, and then analyze with the Life Distribution and Fit Life by X platforms to predict and improve reliability, cut costs and prevent catastrophic failure.
JMP® 9 KEY FEATURES
New Platforms
- The new Degradation platform lets you analyze product deterioration data over time to help you predict product quality and warranty risk.
- The new Neural platform replaces the Neural Net platform and adds enhancements such as richer diagnostics, including several measures of fit and diagnostic plots. With JMP Pro, choose which data to use for cross-validation. Also in JMP Pro, get automated handling of missing data and automated transformation of input variables.
- Use the JMP Profiler to visualize models contained in Excel spreadsheets.
- Optimize and simulate using your Excel spreadsheets.
- Use the add-in toolbar to copy data from Excel into JMP directly.
- Interact with R using JMP Scripting Language (JSL).
- Submit statements to R from within a JSL script.
- Exchange data between JMP and R.
- Display graphics produced by R.
- Incorporate geographic maps into graphs.
- Graph two independent Y variables on separate axes.
- Work with subsets of large data tables using the new Sampling function.
- See the shape of your data using density contours.
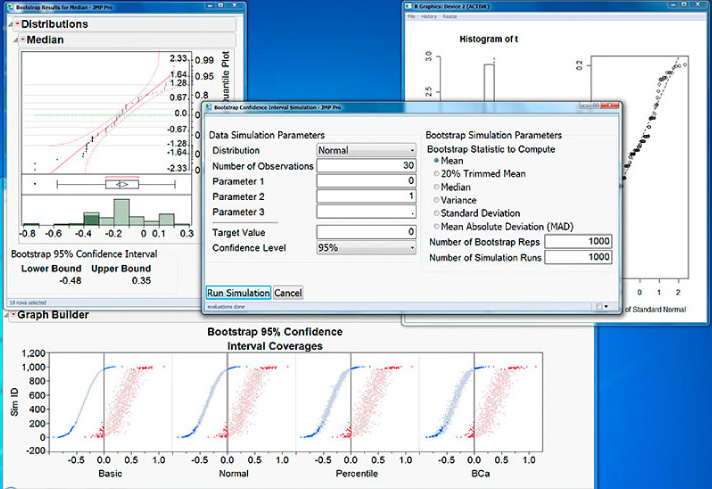
- Plot error bars and confidence intervals.
- A new drop zone under the Group Y area supports a Frequency (or Weight) variable.
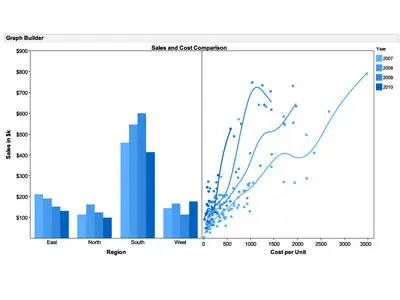
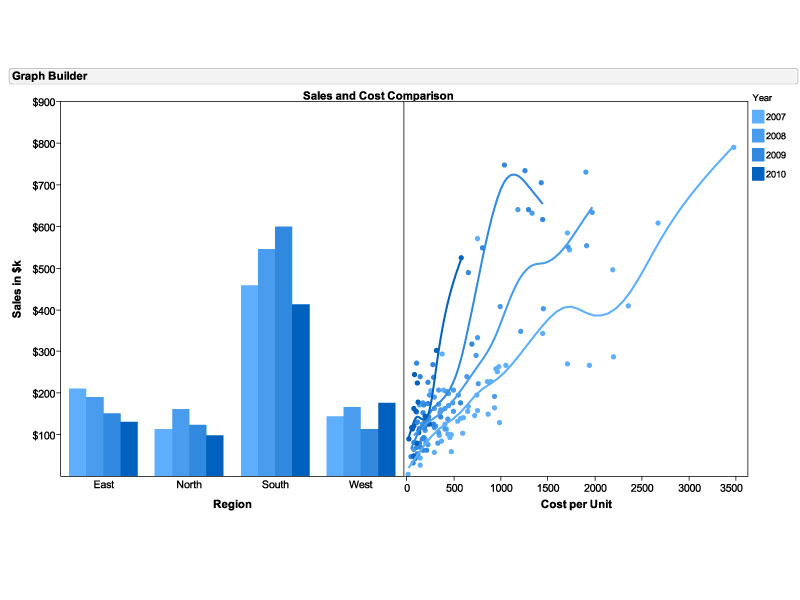
- Graph Builder uses new custom color scale and gradient capabilities.
- User interface for Microsoft Windows has been completely revamped.
- All windows are now independent of one another, so it’s easier to use JMP on multiple monitors.
- The Home window lists JMP files opened recently and all open JMP windows.
- Use bootstrap forests to help ensure your predictions will generalize well.
- Employ boosted trees to increase the accuracy of your predictions.
- Use a cross-validation column to easily compare different model types and make sure that predictions generalize well.
- In Custom Design, choose a new optimality criterion: Minimum Aliasing Design.
- In Custom Design, model and alias terms are available, and an alias model always appears.
- In Custom Design, a color map of correlations of all model terms and aliasing terms appears.
- Accelerated Life Test Design, a new DOE platform, lets you design high stress tests to simulate failure quickly – so you can find product weaknesses more easily and faster.
- In demonstration plans, design a test to compare the reliability of a new product to a standard.
- In reliability test plans, determine the sample size or length of study needed to obtain a given precision about a fitted quantile or probability.
About the Release Notes
JMP 9.0.2 is a general maintenance release that contains enhancements and bug fixes. Note that the list of fixes below is intended to show the scope of the 9.0.2 fixes, but is not a complete list of all fixes. All known reproducible crashes, and all known numeric issues have been corrected. Applying this maintenance release is recommended for all sites.
New Features
- Add ability to specify vertical and horizontal arguments for the Generate Grid() JSL option.
- Add option to List Box (through Set Selected message) for scripts to execute only if the user specifies.
- JMP crashes when the Run Formulas command is sent to a simulation data table that was created in DOE using the Make Table button.
- JMP crashes if incorrect syntax is used for List Box items.
- JMP closes or crashes when the last table is closed when using JMP Automation.
- JMP Automation Document “Name” method does not work.
- The JMP Automation command TableBoxMakeDataTable fails.
- JMP Automation command GetDataTable fails in some circumstances.
- Using JSL, the Bivariate platform now disconnects from the data table when platform results are deleted.
- JMP Excel add-in crashes Excel 2010 on XP.
- Confidence intervals for parameter estimates are incorrect in Choice platform.
- JMP closes unexpectedly when Ctrl-clicking the Match function.
- Arrange Plots option not functional on ALT-click red triangle menu in Overlay Plot.
- Firth Effect Likelihood Ratio Tests and Firth Joint Factor Tests use incorrect likelihood in Choice and GLM platform.
- Contour plot fill option removes some contours.
- Using JSL, JMP produces a Summary table before Concatenation is complete.
- Sequence Fill option no longer fills empty rows to end of table.
- Moving range sigma capability analysis ignores excluded values, weights, and frequencies.
- Fit Model not correctly processing By group analyses if run from a saved script.
- Empty Graph Builder result when copying and pasting.
- The Save Estimates option in Nonlinear does not function properly in the Formula Editor.
- Response counts in Leaf Report for nominal responses should be whole numbers.
- Factor settings change unexpectedly for unlocked factors in Profiler.
- JMP 9 Excel Add-In does not work properly with 64-bit Excel 2010.
- REML Hat statistics don’t match PROC MIXED.
- Scatterplot matrix with nominal data crashes when the Ellipses Coverage option is used.
- Stepwise applies transformation to all response variables.
- JMP cannot connect to SAS after connecting to R.
Homepage: http://www.jmp.com/software/jmp9/
Single link, 434 MB:
SAS.JMP.Statistical.Discovery.v9.0.2-RECOiL.rar
101 MB volumes:
SAS.JMP.Statistical.Discovery.v9.0.2-RECOiL, Filesonic
SAS.JMP.Statistical.Discovery.v9.0.2-RECOiL, Uploaded
No mirrors please
Welcome to my blog!
SAS.JMP.Statistical.Discovery.v9.0.2-RECOiL.rar
101 MB volumes:
SAS.JMP.Statistical.Discovery.v9.0.2-RECOiL, Filesonic
SAS.JMP.Statistical.Discovery.v9.0.2-RECOiL, Uploaded
No mirrors please
Welcome to my blog!