

Tier1App yCrash 3.0.9.4 MultiOS

Tier1App yCrash 3.0.9.4 MultiOS | 538 Mb
Automatically captures & analyzes GC Log, thread dump, heap dump & 16 more artifacts to identify root cause of your production problems.
Monitoring Tools
Industry has seen cutting-edge Application Performance Monitoring tools (i.e., AppDynamics, NewRelic, Dynatrace) and infrastructure monitoring (i.e., Nagios, Ngmon) tools. These monitoring tools are great at answering the question: 'What is the problem?'. i.e., they will tell CPU spiked by x%, memory degraded by y%, and response time shot up by z seconds. But they don't answer the question: 'Why the problem happened?'. i.e., they don't answer: Why CPU spiked up? Why memory degraded? Why response time increased?
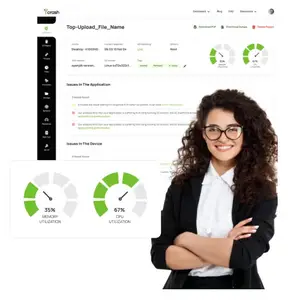
yCrash attempts to answer this question. It captures 360-degree artifacts from your technology stack such as Garbage collection logs, thread dumps, heap dumps, netstat, vmstat, kernel logs… analyzes them and instantly identifies the root cause of the problem.
Zero troubleshooting time!
Say goodbye to the long troubleshooting time. Don't be dependent on your vendors to provide solutions. Don't take hours or weeks to troubleshoot production problems. With yCrash, you can instantly identify the root cause of any complex production problems.
Home Page - https://ycrash.io/