

MedCalc v12.2.1.0 (x86 / x64)
MedCalc v12.2.1.0 (x86 / x64) | 13.1 MB / 16.5 MB
MedCalc is a complete statistical program for Windows designed to closely match the requirements of biomedical researchers. It is fast, user-friendly and reliable. MedCalc is the most user-friendly software for Receiver Operating Characteristic curve (ROC curves) analysis. The software also includes Bland & Altman plot, Passing and Bablok and Deming regression for method comparison studies.
MedCalc for Windows description
Data management
Integrated spreadsheet with 16384 columns and up to 100000 rows.
Correct handling of missing data.
Outliers can easily be excluded.
Built-in WYSIWYG text editor.
Imports Excel, Excel 2007, SPSS, DBase and Lotus files, and files in SYLK, DIF or plain text format.
Easy selection of subgroups for statistical analysis.
Documentation
Comprehensive help file.
Manual in PDF format (go to download area).
Complete HTML manual on MedCalc web site.
Context help in dialog boxes.
ROC curve analysis
Area under the curve (AUC) with standard error, 95% confidence interval, P-value. Offers choice between methodology of DeLong et al. (1988) and Hanley & McNeil (1982, 1983).
List of sensitivity, specificity, likelihood ratios, and positive and negative predictive values for all possible threshold values.
ROC curve graph with 95% Confidence Bounds.
Threshold values can be selected in an interactive dot diagram with automatic calculation of corresponding sensitivity and specificity.
Plot of sensitivity and specificity versus criterion values.
Interval likelihood ratios.
Comparison of up to 6 ROC curves: difference between the areas under the ROC curves, with standard error, 95% confidence interval and P-value.
Sample size calculation for area under ROC curve and comparison of ROC curves.
Go to the ROC curve analysis section of the MedCalc manual for more information on ROC curve analysis in MedCalc.
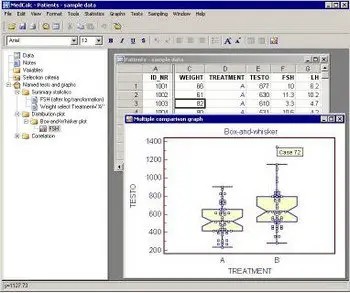
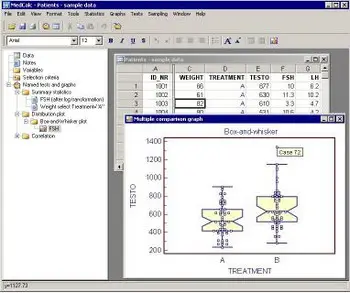
Graphs
Lots of graphs, see Graph gallery.
Data point identification in graphs.
Draw text boxes, lines, arrows and connectors.
Name, save and recall graphs and statistics.
Statistical info in graph windows.
Homepage: http://www.medcalc.org
No mirrors please