
Exelis ENVI 5.3.1

Exelis ENVI 5.3.1 | 2.7 Gb
The Harris Geospatial Solutions, Inc , develops products for the visualization, analysis, and management of geospatial imagery and scientific data, has unveiled ENVI 5.3.1. This update packed full of new features and functionality that will help you do more with your geospatial data than ever before.
What's New in ENVI 5.3, Service Pack 1
This software release includes the new and enhanced features listed below.
- Sensors and Data Formats
- Image Processing and Display
- User Interface
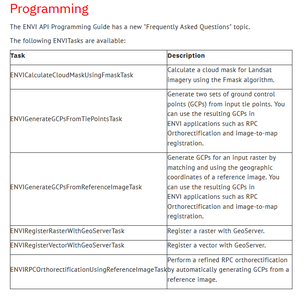
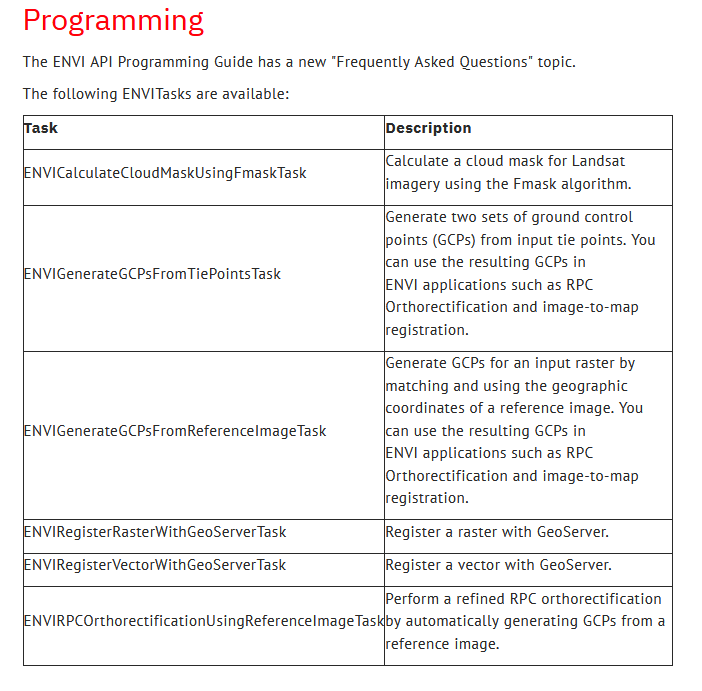
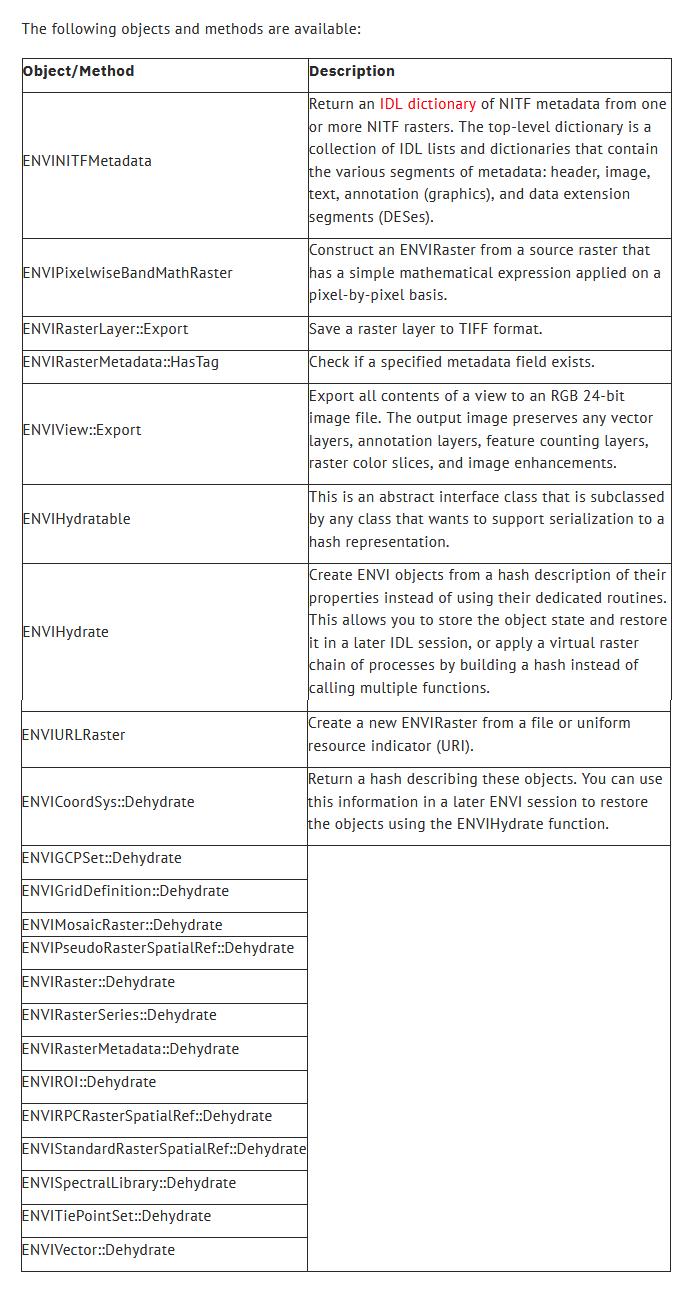
- Programming
Sensors and Data Formats
ENVI reads and displays imagery from the following sensors and data formats:
- Windows only: COLLADA 1.4.1 and 1.5. Support is provided for building extraction when using the ENVI LiDAR API. See the ENVIPointCloudFeatureExtractionTask and ENVIPointCloudProductsInfo help topics for details.
Image Processing and Display
You can use the Data Manager to display an RGB layer using bands from different coregistered images. Example use cases include medical imagery, microscopy imagery, time series imagery, or any scenario where imagery is distributed with separate bands in separate files. See the "Manage Raster Layers" help topic for instructions. This only creates a layer for display. To create an RGB layer that you can export, continue to use the Layer Stacking tool or the ENVIMetaspectralRaster routine in the API.
Landsat GeoTIFF files with metadata (*MTL.txt) are displayed with the data ignore value header field set to 0. As a result, scan line and background pixels display as 'No Data'.
Use the Calculate Cloud Mask Using Fmask Algorithm tool to create a cloud mask for all Landsat sensors. ENVI uses the Fmask algorithm cited in the following references:
Zhu, Z., S. Wang, and C. E. Woodcock. "Improvement and Expansion of the Fmask Algorithm: Cloud, Cloud Shadow, and Snow Detection for Landsats 4-7, 8, and Sentinel 2 Images." Remote Sensing of Environment 159 (2015): 269-277, doi:10.1016/j.rse.2014.12.014 (paper for Fmask version 3.2).
Zhu, Z., and C. E. Woodcock. "Object-Based Cloud and Cloud Shadow Detection in Landsat Imagery." Remote Sensing of Environment 118 (2012): 83-94, doi:10.1016/j.rse.2011.10.028 (paper for Fmask version 1.6).
The ENVI LiDAR application automatically reprojects any background shapefiles that you import to match the projection of the current project.
Use the Generate GCPs From Reference Image tool to automatically generate ground control points (GCPs) for an input raster. The process works by matching and using the geographic coordinates of an orthorectified base image. The elevation values of the GCPs are calculated from a DEM raster. The input raster must have an RPC spatial reference. This tool allows you to generate GCPs for further manipulation or for immediate use with applications such as image-to-map registration, Rigorous Orthorectification, DEM Extraction, and the RPC Orthorectification workflow.
Use the RPC Orthorectification Using Reference Image tool to perform a refined RPC orthorectification by automatically generating GCPs from an orthorectified reference image. This is an automated end-to-end solution; continue to use the RPC Orthorectification workflow if you want to edit GCPs and review error statistics in an interactive environment.
The RPC Orthorectification tutorial uses new data files: an OrbView-3 source image, a National Agriculture Imagery Program (NAIP) reference image, and a National Elevation Dataset (NED) DEM at 1/9 arc-second resolution. The tutorial shows how to automatically generate GCPs in the RPC Orthorectification Workflow and with the RPC Orthorectification Using Reference Image tool.
User Interface
The Cursor Value tool was redesigned as follows:
- The main toolbar no longer contains a Crosshairs button. Instead, the Cursor Value dialog has an On demand updates button. When this button is active, you can click on a pixel or vector record in the display and a set of crosshairs (now called a probe) is displayed over that location. The Cursor Value dialog reports information for the selected pixel or vector record.
- When the On demand updates button is active, you can copy cursor value information to the system clipboard.
- Disable the On demand updates button to turn off the probe and to report real-time pixel information as you move around the display.
- You can report cursor value information for the top layer only or all available layers.
- When multiple views of georeferenced data are displayed and the On demand updates button is active, you can link the views. Moving the probe in one view will move it to the corresponding location in the other views.
The File > Open As menu was divided into different categories of sensors and data formats.
The Data Manager, Layer Manager, and Spectral Profiles show wavelength colors next to each listed band if wavelengths are defined in the header file. Bands with invisible wavelengths are colored black. If an image has bad bands defined in the header file, those bands are marked with a warning symbol.
Spectral Profiles have a new Wavelength Color option to display visible wavelength colors along the x-axis.
Right-click on the View icon in the Layer Manager and select Show All Layers and Hide All Layers to show/hide all layers at once.
Right-click on a raster layer in the Layer Manager and select Export Layer to TIFF to save the full raster layer extent and image enhancements to a TIFF file, at full resolution.
Use the File > Export View To > Image File menu option to export all contents of a view to an RGB 24-bit image file in ENVI or TIFF/GeoTIFF format. The output image preserves any vector layers, annotation layers, feature counting layers, raster color slices, and image enhancements. You can set the output zoom factor, or if the view has a base standard map projection, you can set the output map scale.
The Navigation window of the ENVI LiDAR application contains a View Point Density setting that allows you to preview different point-density settings in the Main window. It does not affect the point density for final processing.
When distinct point classifications are present in the input file, click on the new Color by Classification button in the ENVI LiDAR application toolbar to color points by classification.
The Edit Raster Color Slices dialog was updated as follows:
- Click on any color to display a color selection dialog where you can choose a different color for a specific range of values.
- A new Export drop-down button lets you export the color slices to a shapefile or classification image.
The Dataset Browser now supports HDF5 one-dimensional datasets.
![Exelis ENVI 5.3.1]()
![Exelis ENVI 5.3.1]()
ENVI reads and displays imagery from the following sensors and data formats:
- Windows only: COLLADA 1.4.1 and 1.5. Support is provided for building extraction when using the ENVI LiDAR API. See the ENVIPointCloudFeatureExtractionTask and ENVIPointCloudProductsInfo help topics for details.
Image Processing and Display
You can use the Data Manager to display an RGB layer using bands from different coregistered images. Example use cases include medical imagery, microscopy imagery, time series imagery, or any scenario where imagery is distributed with separate bands in separate files. See the "Manage Raster Layers" help topic for instructions. This only creates a layer for display. To create an RGB layer that you can export, continue to use the Layer Stacking tool or the ENVIMetaspectralRaster routine in the API.
Landsat GeoTIFF files with metadata (*MTL.txt) are displayed with the data ignore value header field set to 0. As a result, scan line and background pixels display as 'No Data'.
Use the Calculate Cloud Mask Using Fmask Algorithm tool to create a cloud mask for all Landsat sensors. ENVI uses the Fmask algorithm cited in the following references:
Zhu, Z., S. Wang, and C. E. Woodcock. "Improvement and Expansion of the Fmask Algorithm: Cloud, Cloud Shadow, and Snow Detection for Landsats 4-7, 8, and Sentinel 2 Images." Remote Sensing of Environment 159 (2015): 269-277, doi:10.1016/j.rse.2014.12.014 (paper for Fmask version 3.2).
Zhu, Z., and C. E. Woodcock. "Object-Based Cloud and Cloud Shadow Detection in Landsat Imagery." Remote Sensing of Environment 118 (2012): 83-94, doi:10.1016/j.rse.2011.10.028 (paper for Fmask version 1.6).
The ENVI LiDAR application automatically reprojects any background shapefiles that you import to match the projection of the current project.
Use the Generate GCPs From Reference Image tool to automatically generate ground control points (GCPs) for an input raster. The process works by matching and using the geographic coordinates of an orthorectified base image. The elevation values of the GCPs are calculated from a DEM raster. The input raster must have an RPC spatial reference. This tool allows you to generate GCPs for further manipulation or for immediate use with applications such as image-to-map registration, Rigorous Orthorectification, DEM Extraction, and the RPC Orthorectification workflow.
Use the RPC Orthorectification Using Reference Image tool to perform a refined RPC orthorectification by automatically generating GCPs from an orthorectified reference image. This is an automated end-to-end solution; continue to use the RPC Orthorectification workflow if you want to edit GCPs and review error statistics in an interactive environment.
The RPC Orthorectification tutorial uses new data files: an OrbView-3 source image, a National Agriculture Imagery Program (NAIP) reference image, and a National Elevation Dataset (NED) DEM at 1/9 arc-second resolution. The tutorial shows how to automatically generate GCPs in the RPC Orthorectification Workflow and with the RPC Orthorectification Using Reference Image tool.
User Interface
The Cursor Value tool was redesigned as follows:
- The main toolbar no longer contains a Crosshairs button. Instead, the Cursor Value dialog has an On demand updates button. When this button is active, you can click on a pixel or vector record in the display and a set of crosshairs (now called a probe) is displayed over that location. The Cursor Value dialog reports information for the selected pixel or vector record.
- When the On demand updates button is active, you can copy cursor value information to the system clipboard.
- Disable the On demand updates button to turn off the probe and to report real-time pixel information as you move around the display.
- You can report cursor value information for the top layer only or all available layers.
- When multiple views of georeferenced data are displayed and the On demand updates button is active, you can link the views. Moving the probe in one view will move it to the corresponding location in the other views.
The File > Open As menu was divided into different categories of sensors and data formats.
The Data Manager, Layer Manager, and Spectral Profiles show wavelength colors next to each listed band if wavelengths are defined in the header file. Bands with invisible wavelengths are colored black. If an image has bad bands defined in the header file, those bands are marked with a warning symbol.
Spectral Profiles have a new Wavelength Color option to display visible wavelength colors along the x-axis.
Right-click on the View icon in the Layer Manager and select Show All Layers and Hide All Layers to show/hide all layers at once.
Right-click on a raster layer in the Layer Manager and select Export Layer to TIFF to save the full raster layer extent and image enhancements to a TIFF file, at full resolution.
Use the File > Export View To > Image File menu option to export all contents of a view to an RGB 24-bit image file in ENVI or TIFF/GeoTIFF format. The output image preserves any vector layers, annotation layers, feature counting layers, raster color slices, and image enhancements. You can set the output zoom factor, or if the view has a base standard map projection, you can set the output map scale.
The Navigation window of the ENVI LiDAR application contains a View Point Density setting that allows you to preview different point-density settings in the Main window. It does not affect the point density for final processing.
When distinct point classifications are present in the input file, click on the new Color by Classification button in the ENVI LiDAR application toolbar to color points by classification.
The Edit Raster Color Slices dialog was updated as follows:
- Click on any color to display a color selection dialog where you can choose a different color for a specific range of values.
- A new Export drop-down button lets you export the color slices to a shapefile or classification image.
The Dataset Browser now supports HDF5 one-dimensional datasets.
Exelis ENVI 5.3.1
Exelis ENVI 5.3.1
Exelis ENVI 5.3.1
ENVI is the industry standard for image processing and analysis software. It is used by image analysts, GIS professionals and scientists to extract timely, reliable and accurate information from geospatial imagery. It is scientifically proven, easy to use and tightly integrated with Esri’s ArcGIS platform.
ENVI has remained on the cutting edge of innovation for more than three decades due in part to its support of all types of data including multispectral, hyperspectral, thermal, LiDAR and SAR. ENVI makes deep learning accessible to people through intuitive tools and workflows that don’t require programming. ENVI geospatial image analysis can also be customized through an API and visual programming environment to meet specific project requirements
What's New in ENVI 5.3 | Webinar
ENVI 5.3 is packed full of new features and functionality that will help you do more with your geospatial data than ever before.
L3Harris Geospatial is an industry leading developer of image analysis and data visualization software tools to help professionals across industries and disciplines solve complex problems. L3Harris Geospatial provides desktop, cloud and mobile software solutions to help professionals across industries transform geospatial imagery and complex data into actionable information. Our products ENVI, IDL, and SARscape allow to quickly and easily visualise and analyse all types of data and imagery for better, more informed decision making. Combined with classroom and onsite training, best-in-class customer support, and custom consulting, L3Harris Geospatial software products provide leading edge technology to span the imagery workflow, from data ingest to exploitation and delivery.
Product: Exelis ENVI
Version: 5.3.1 *
Supported Architectures: x64
Website Home Page : www.l3harrisgeospatial.com
Languages Supported: english
System Requirements: PC *
Size: 2.7 Gb
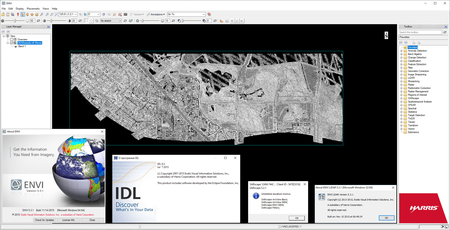
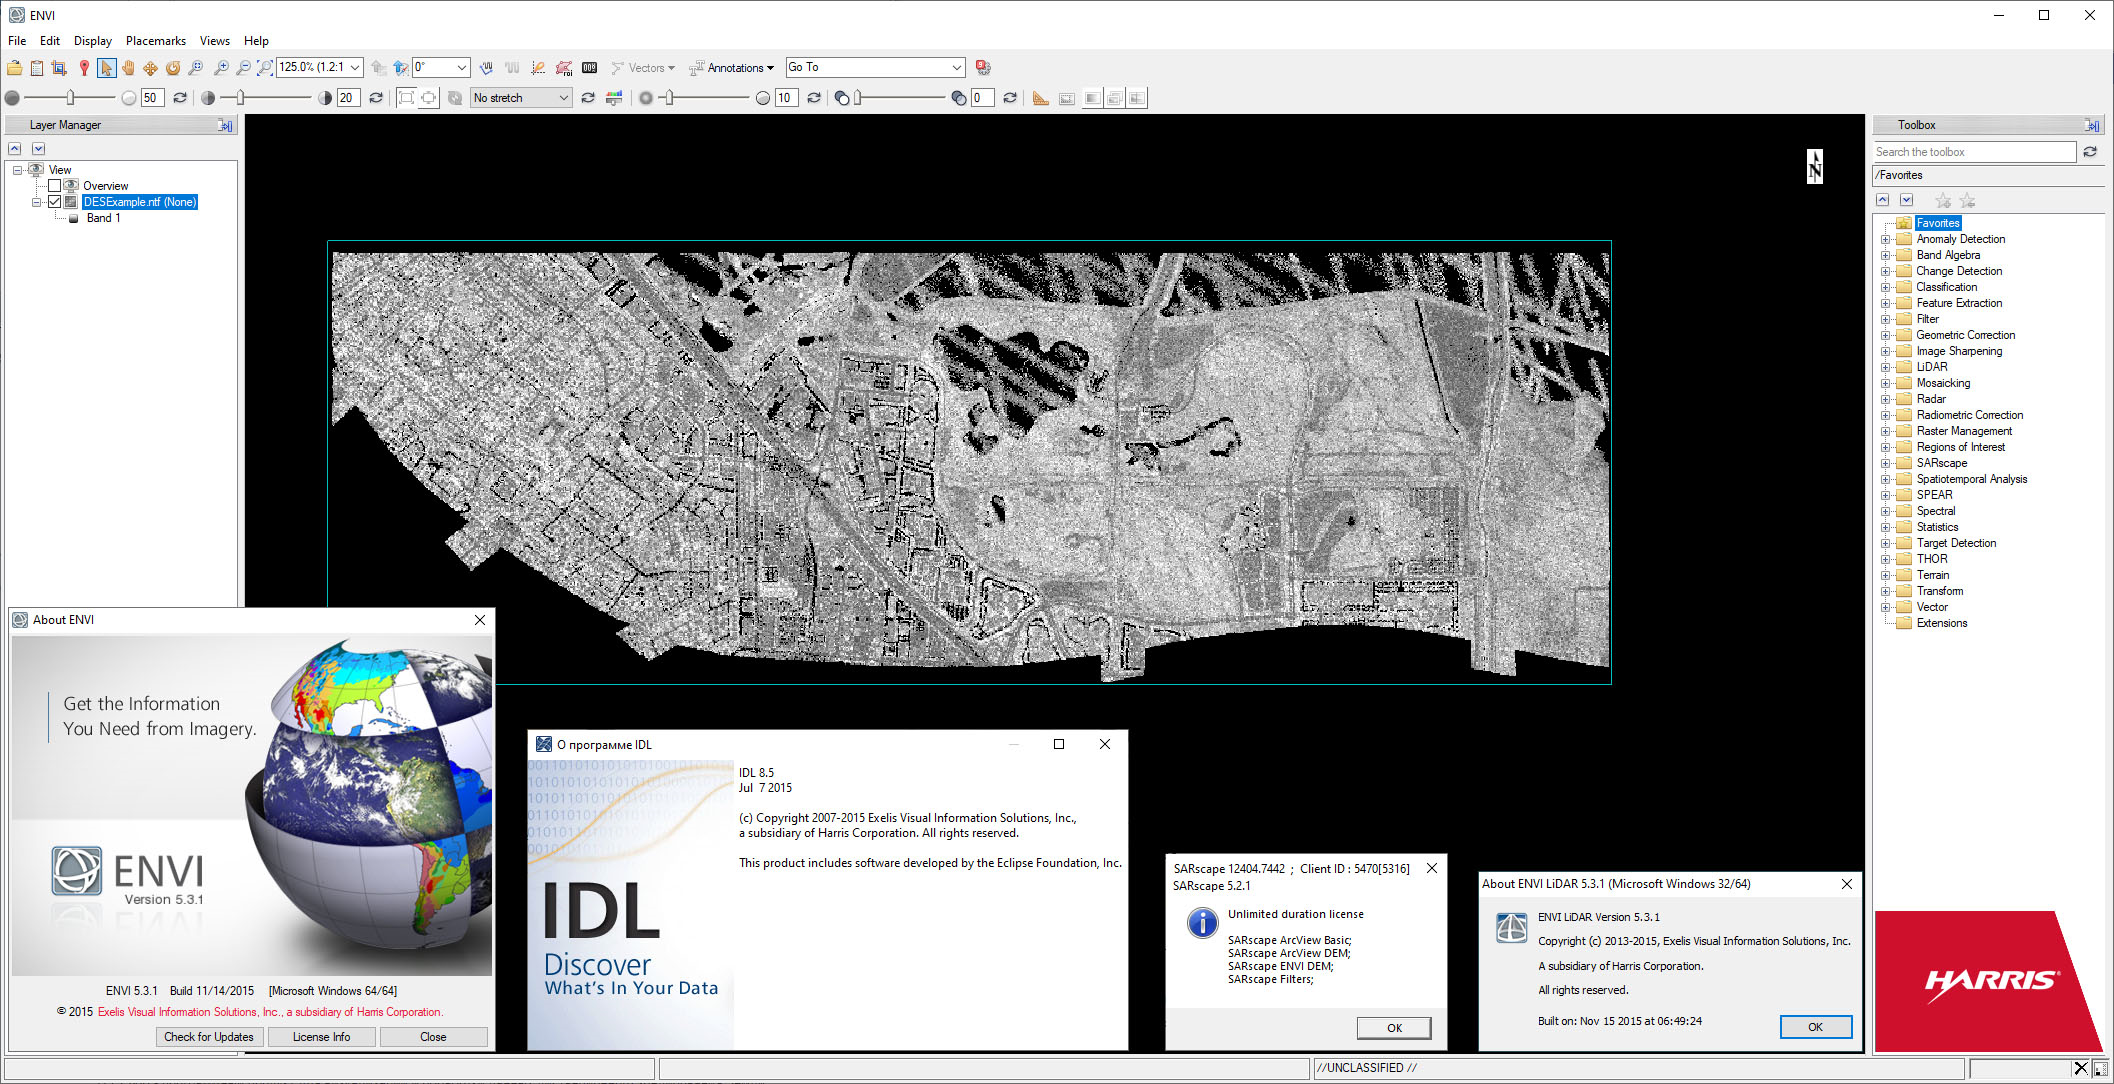
- Exelis ENVI 5.3.1
ENVI Image Processing & Analysis Software is the premier software solution for processing & analyzing geospatial imagery. Used by image analysts, GIS professionals, scientists and researchers.
- IDL 8.5
IDL (Interactive Data Language) software is the trusted scientific programming language used across disciplines to create meaningful visualizations out of complex numerical data. From small-scale analysis programs to widely deployed applications, IDL provides the comprehensive computing environment you need to effectively get information from your data.
- ENVI LiDAR 5.3.1
ENVI LiDAR is an interactive geospatial software environment that allows you to create realistic 3D visualizations and easily extract important features (trees, powerlines, buildings) from LiDAR point cloud data. Elevation information contained within LiDAR can be included in your geospatial analysis projects such as viewshed and line-of-sight studies, forest inventories, right-of-way analyses, and urban planning applications. With ENVI LiDAR, you have the software tool to quickly prepare LiDAR data, accurately extract 3D features, fine-tune results, and export your results to your existing tools, such as ENVI or ArcMap, for further analysis or inclusion in your geospatial products.
- ENVI SARscape 5.2.1
Synthetic Aperture Radar (SAR) is used around the world due to its many benefits such as its ability to capture data at night and see through cloud cover, dust and smoke. Because of this, there are many applications where SAR can provide critical information about an area or objects of interest.
For decades, L3Harris and sarmap SA have teamed up to provide ENVI SARscape, making the benefits of SAR data available to everyone. ENVI SARscape allows you to easily process and analyze SAR data, while giving you the option to integrate this information with other geospatial products. This unique data analysis capability turns your data into meaningful insights and answers.
Exelis ENVI 5.3.1

Please visit my blog
Added by 3% of the overall size of the archive of information for the restoration
No mirrors please

![Exelis ENVI 5.3.1]()
Added by 3% of the overall size of the archive of information for the restoration
No mirrors please
Exelis ENVI 5.3.1