

EJ Technologies JProfiler v6.1.1 Linux

EJ Technologies JProfiler v6.1.1 Linux | 23.26 MB
JProfiler is an award-winning all-in-one Java profiler. JProfiler's intuitive GUI helps you find performance bottlenecks, pin down memory leaks and resolve threading issues.
Features:
Exceptional ease of use
When you profile, you need the most powerful tool you can get. At the same time, you do not want to spend time learning how to use the tool. JProfiler is just that: simple and powerful at the same time. Configuring sessions is straight-forward, third party integrations make getting started a breeze and profiling data is presented in a natural way. On all levels, JProfiler has been carefully designed to help you get started with solving your problems.
The quick start dialog helps you get started with JProfiler
Real-time display of profiling data
With JProfiler you can immediately observe profiling data as your application is running. CPU, memory and thread profiling views are updated live and can be inspected without the need to wait for the measurement to complete. For a large number of use-cases, this ability provides you with an extremely fast path to a solution. In addition, you can save snapshots at any time, interactively as well as programmatically.
Live differencing makes it easy to spot the cause of a memory leak
The unique heap walker
Finding a memory leak can be impossible without the right tool. JProfiler's heap walker offers you an intuitive interface to solve both simple and complex memory problems. 5 different views show different aspects of the current set of objects. Each view allows you to create new object sets based on the displayed data. Each view provides you with essential insights on the selected objects. Questions like why objects are not garbage collected are answered with a single click of the mouse.
The heap walker makes finding memory leaks easy
The powerful CPU profiler
Fixing performance bottlenecks is the most frequent use case for a profiler. However, CPU data can be overwhelming in its level of detail and the way data is collected can make a huge difference in usability. With JProfiler, you have a decisive advantage when trying to find the reason for a problem. Call tree view filters, aggregation levels and thread status selectors are just some examples of JProfiler's versatility in this area.
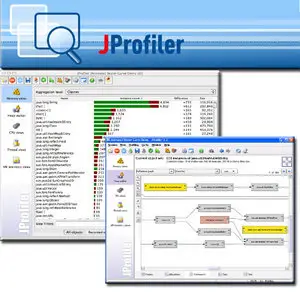
The call graph is one of the views on CPU profiling data in JProfiler
The integrated thread profiler
Problems related to threading are much more frequent than one might assume. Without a thread profiler, you only have a minimal chance to tackle such issues. A whole range of otherwise opaque problems can be solved when using JProfiler, such as increasing liveness in a multi-threaded application that uses too much locking. Thread profiling not only has a separate view section in JProfiler, it is also tightly integrated into the CPU profiling views.